
An Urban Study:
the regional influence of potential subway constructions in Queens, New York
Supervisor: Lucien Wilson
Team Member: Yun Gong, Ubaldo Escalante, Ran Song
Role: Team Leader. Critical role in brainstorm & research methodologies. Compose all Grasshopper Script
00 Project Background
The City of New York was planning a series of substations based on an existing railroad located in Queens. By analyzing existing data, we are trying to determine the location of each train station and provide suggestions for further urban development when the stations were open.
01 Source of Data
02 Study Structure
1. Brooklyn Study
Because of the similarity of Brooklyn and Queens, we categorize different stations in Brooklyn by its data and determine the best stations of different categories using Q-score. So that we could use the best stations as guidelines for the relative development in Queens.
2. Queens Station Location Filtering and Matching
By weighing the construction cost and potential impact to the adjacent residents, we analyze existing data and manually select locations for the subway station construction. We apply the same categorization standard to the stations in Queens and using the best station of the same category in Brooklyn as guidelines for future development.
3. Development Suggestion Iteration and Evaluation
After iterating different proposals for development, we evaluate different results by its potential impact of the area and pick the best plan for its development.

Grasshopper Script for Brooklyn Subway Station Evaluation
03 Brooklyn Study
In our research process, we find the similarity between Brooklyn and Queens. With an already fully developed subway system, Brooklyn could be seen as a future version of Queens. Consequently, if we study the existing situation of the subway station in Brooklyn, and find ways to evaluate it, we are able to use the data we selected as a guideline for the development of similar subway stations in Queens.
In regard, by using Grasshopper, we extract from PLUTO database the following data in the radius of 0.5 miles and 0.25 miles of each station: Q-score, Land Use, Average FAR (For whole radius and different land use), Population Density (Determined by residential area), Land Price(Average and Total).

Brooklyn Data Extraction Panel (Script Generated)
With the following steps, we analyze the data to categorize different station and determine the best station for different category:
(1) By comparing the average Q-score of 0.5 miles and 0.25 miles radius of the same station, we eliminate stations that are much safer when you get close to the station.
(2) In the rest of the sample, we divide them by land use(Which sample has the most residential, commercial, industrial, and public building block), and filter the best 20 Q-score of the four categories.

(3) After filtering the best 20 Q-score, we subdivide each group into four smaller groups:
a. Samples with high population density, high land price, high q-score
b. Samples with low population density, high land price, high q-score
c. Samples with high population density, low land price, high q-score
d. Samples with low population density, low land price, high q-score
Q-Score Filtering
05 Queens Station Location Filtering and Matching
With the following steps, we are trying to manually filter the physical location of the train station for further analysis.
-
Set 0.5 miles as the subway’s service radius
-
Filtering vacant land in the service radius using PLUTO data (Deduct demolition cost)
-
Filtering Government Properties in the service radius (Deduct land purchasing cost)
-
Calculate population density, analyze transportation convenience in the service radius (Consider the actual service radius of the subway station)
-
According to previous research, based on the principle that each subway station is within 0.5-mile reach (exclude subway station in the middle of vacant land), manually select the physical location of each subway station, Demonstrated below.

Queens Station Proposed Location
We apply the same categorization standard to the stations in Queens and match it with the best station of the same category in Brooklyn.
Then we are using the commercial/residential building block ratio in Brooklyn as the development guideline in the related area in Queens.
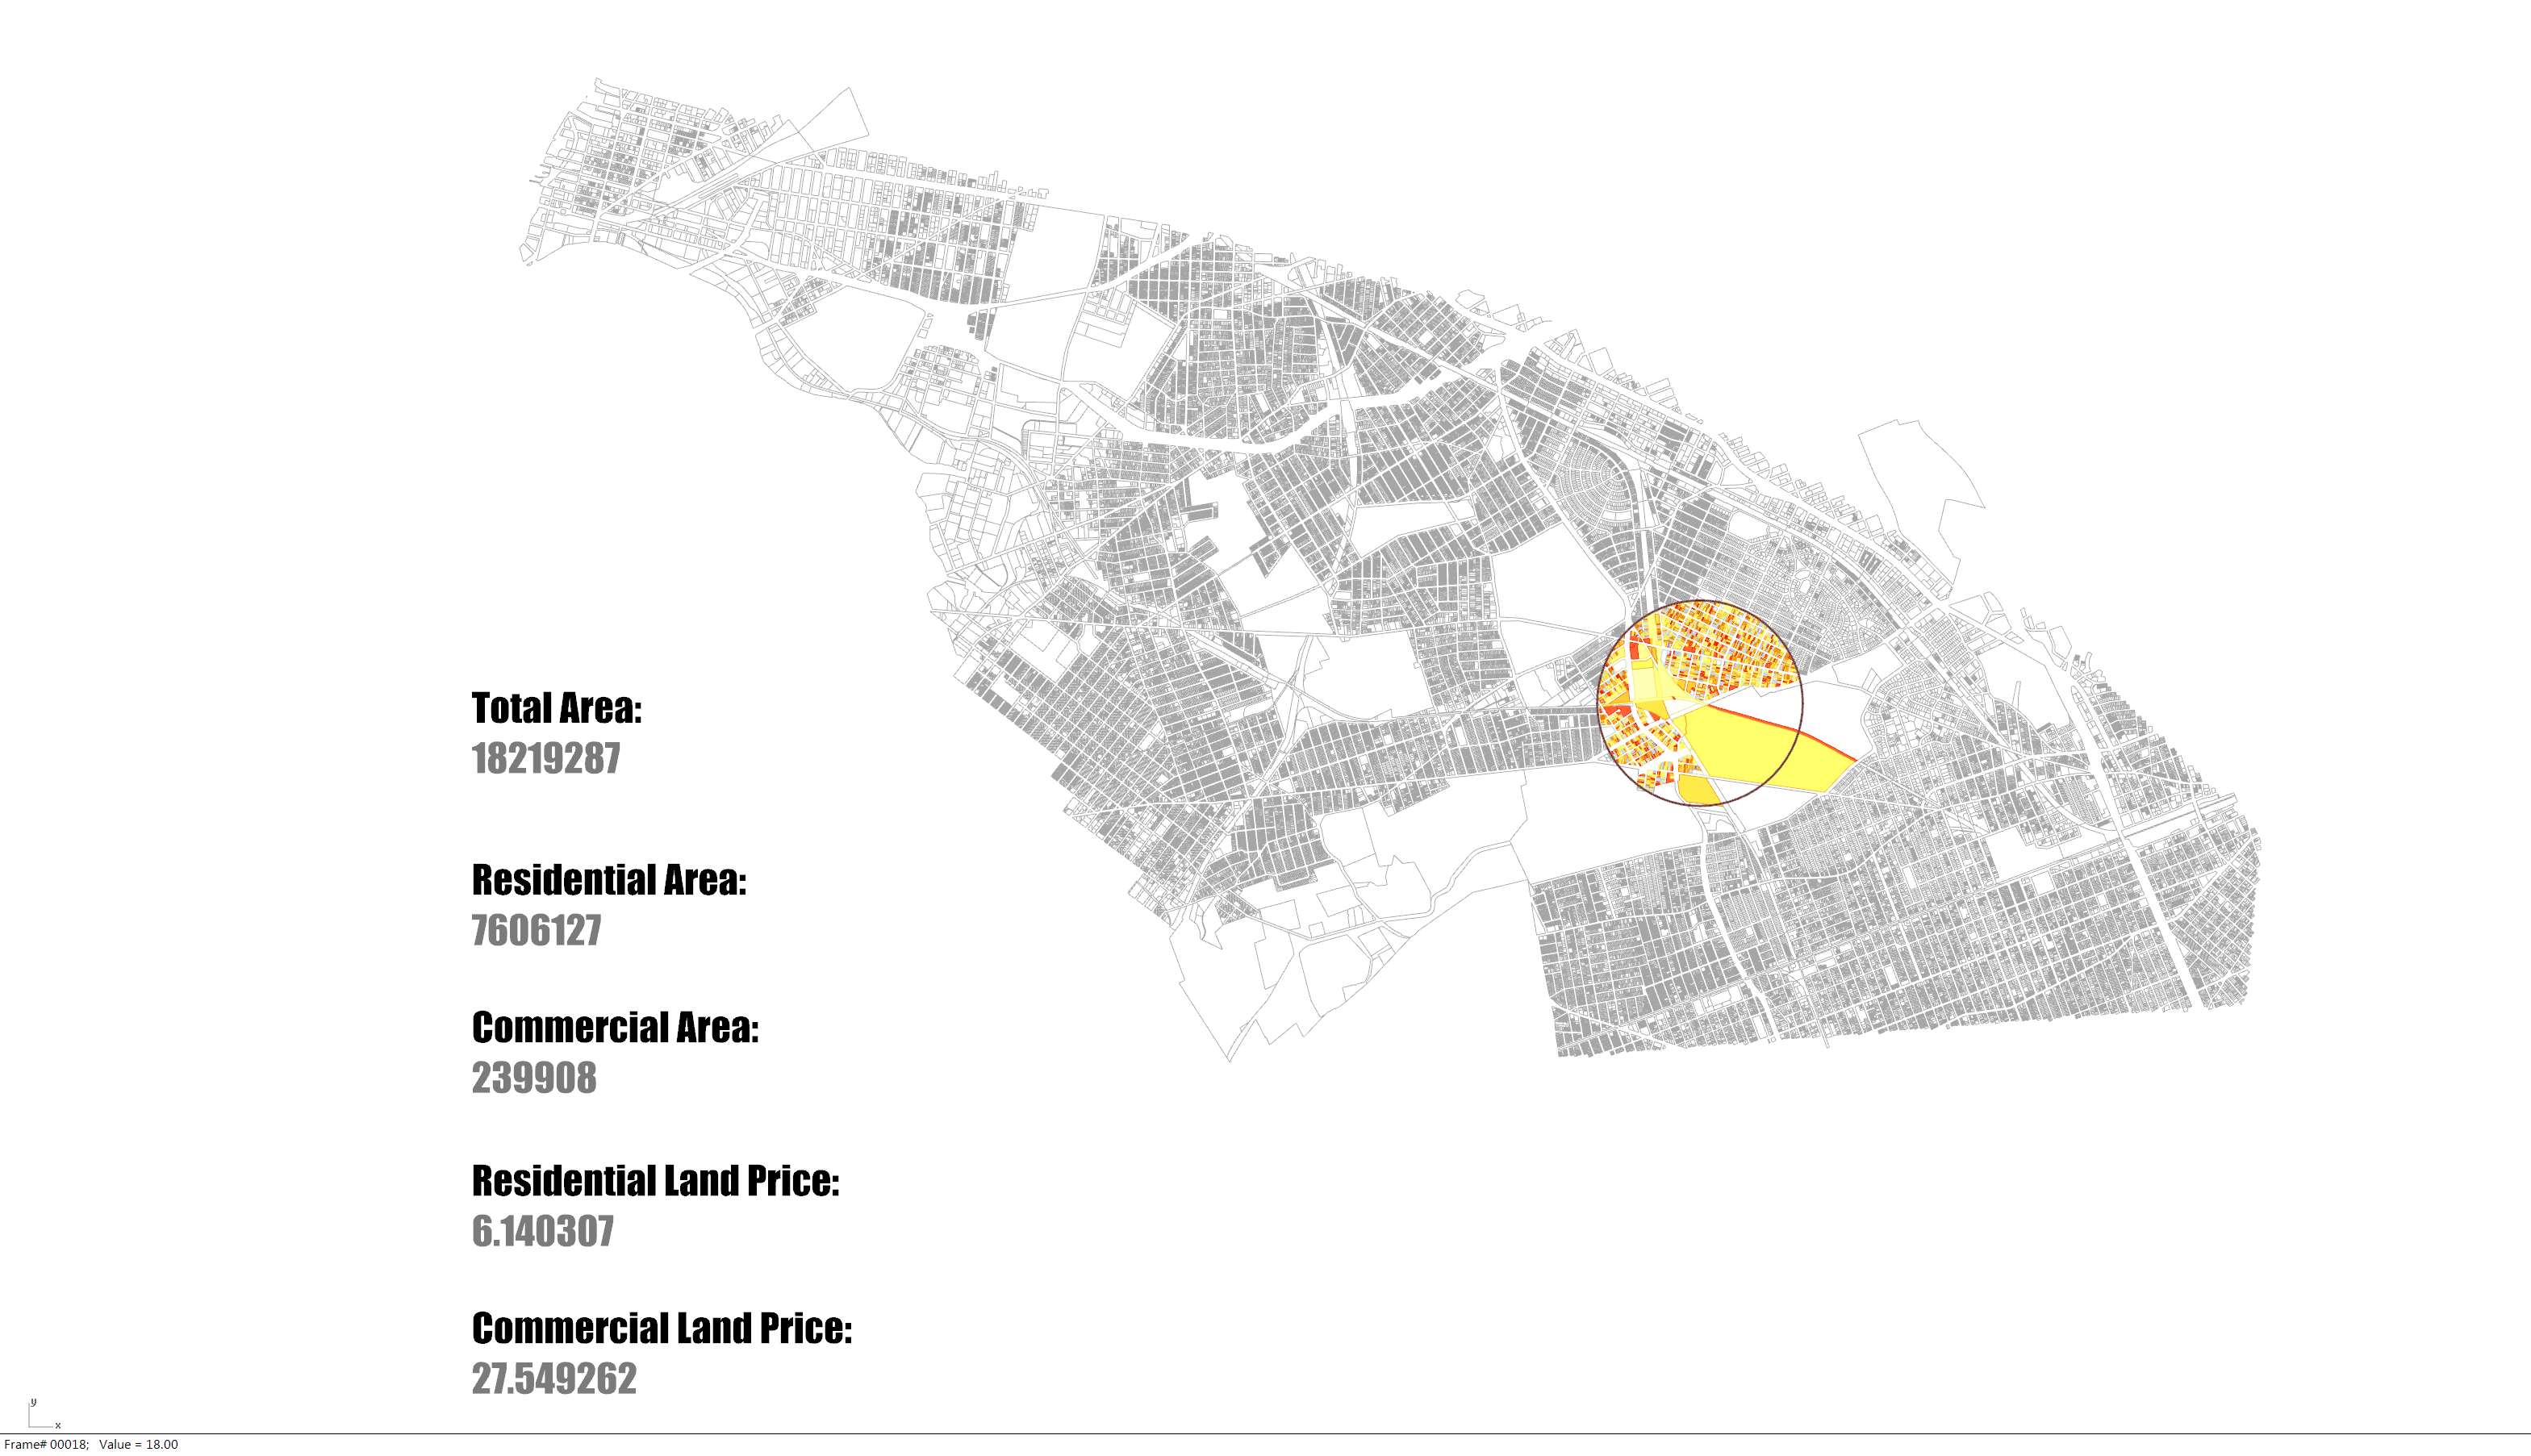
Queens Railroad Station Data Filtering
06 Development Suggestions Iteration & Evaluation
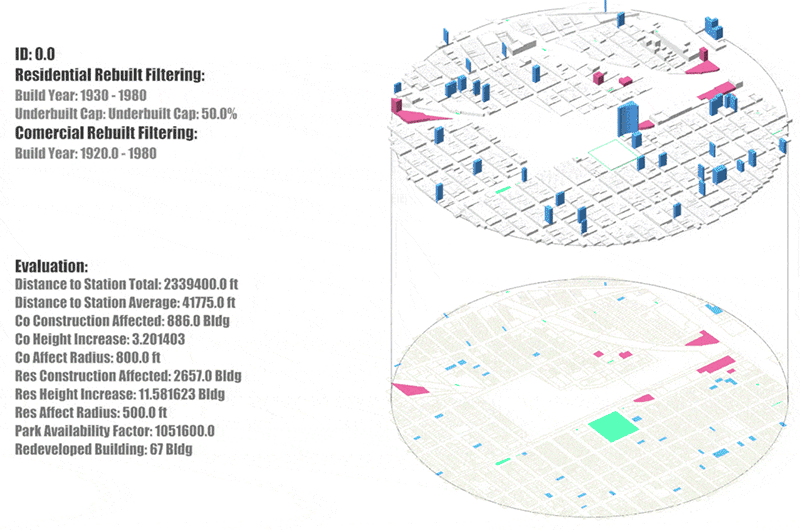
By setting paying the subway station construction fee with extra tax income the area development could bring as a goal, we calculate the total increased area for different types of building blocks.
After that, we are trying to iterate different combinations of building blocks that are going to be modified by tweaking the year of built and the underbuilt ratio. (Existing FAR/Allowed maximum ratio). Then we are using subway station attraction and railroad attraction to distribute the total increased area to those different combinations, consequently, we would know the increased numbers of floors of each combination.
After iterating every possible combination, we have 54 versions of development plans for evaluation.


Residential Data Filtering and Reconstruction


Commercial Data Filtering and Reconstruction
After iterating every possible combination, we have 54 versions of development plans for evaluation.
Iterations of different Development Plan
By calculating the distance from modified building block to subway, to park, the potential influence of the construction on modified building block, the expected height of the modified building block, and the number of the modified building block, we could evaluate the 54 development plan, and calculate the best one according to the weight we give to the different criteria.

Top Development Result
07 Whole Progress Presentation Deck
For further reference of this project, please see the presentation deck below